

The political map of the American South looks considerably different following the 2026 midterm elections, with Democratic candidates making gains in several states where Republicans have traditionally enjoyed strong support. Behind the results, however, were two striking voting patterns that helped explain how the political balance shifted across the region.
An NPR analysis of turnout data found that Democratic candidates benefited from voters in traditionally Democratic counties returning to the polls in greater numbers, while Republican support declined much more sharply in counties Donald Trump carried in 2024. The difference was substantial enough to influence Senate races across multiple Southern states and expose a significant change in the region’s electoral dynamics.
Democrats Held On To More Of Their Previous Voters
Midterm elections generally attract fewer voters than presidential contests, making turnout an important factor in determining which party gains an advantage. The 2026 election followed that familiar pattern, but the difference between Democratic and Republican voting areas was particularly noticeable across the South.
NPR examined election data from six states: Louisiana, Mississippi, Alabama, Georgia, South Carolina and North Carolina. The analysis compared voter participation in counties that supported former Vice President Kamala Harris in 2024 with participation in counties that backed Trump during the same election.
The results revealed that turnout declined by approximately 19% in counties Harris had won, compared with a 26% decline in counties carried by Trump. That seven-percentage-point difference gave Democratic candidates an advantage in numerous communities where Republicans had previously received more votes.
The regional shift was also considerably larger than the movement recorded nationally. Across the six Southern states, the average swing towards Democrats reached approximately 22 percentage points, compared with a national swing of around 14.5 percentage points.
This difference was reflected in the actual number of ballots received by candidates. Democratic Senate nominees in the six states collected more raw votes than Harris had received in 170 counties during the 2024 presidential election. Republican nominees, meanwhile, received hundreds of thousands fewer votes than Trump had collected across the same states.
The figures offer an important explanation for the election results because they show how the composition of the electorate changed between presidential and midterm voting. Democratic candidates were able to retain a larger proportion of their previous support, while Republican candidates faced a more substantial decline in participation among voters in Trump-supporting communities.
Why The Difference In Turnout Mattered

The seven-percentage-point turnout gap might appear relatively small when viewed in isolation, but its effect becomes clearer when applied across hundreds of counties. Senate elections can be decided by relatively narrow margins, particularly in states where the two parties have substantial competing support.
When Democratic voters returned to the polls at higher rates, their candidates had a stronger opportunity to compete in counties that had supported Republicans during the previous presidential election. At the same time, lower Republican participation reduced the number of votes available to GOP candidates.
The combined effect contributed to Democratic Senate victories in North Carolina, South Carolina and Mississippi. It also helped produce a closer-than-expected result in Louisiana’s Senate race, demonstrating how turnout patterns can influence contests across an entire region.
Black Voter Participation Emerged As Another Major Factor
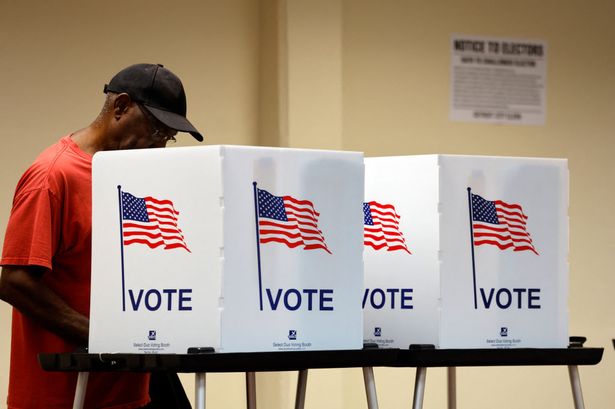
The second major trend identified in the analysis involved increased participation in majority-Black counties. These communities recorded higher turnout than majority-white, non-Hispanic counties, adding another important dimension to the Democratic gains across the South.
According to NPR’s figures, majority-Black counties recorded approximately 85% voter turnout. Majority-white, non-Hispanic counties recorded around 76%, creating a nine-percentage-point difference between the two groups.
The increased participation was particularly visible in Mississippi. Of the 16 majority-Black counties that recorded more Democratic votes than they had in 2024, 12 were located in the state.
Clay County, Mississippi, experienced the largest increase in turnout among the counties examined. Its participation rate rose by approximately 17 percentage points compared with the 2024 presidential election, highlighting the extent of the change in certain communities.
These figures followed a period in which special elections and primary contests had already shown signs of increased Black voter participation. The pattern continued during the midterms, giving Democratic candidates additional support in several important Southern communities.
Voting Rights And Redistricting Became Part Of The Election Debate

The turnout figures also emerged against the backdrop of a major dispute over voting rights and congressional representation. The Supreme Court’s decision in Louisiana v. Callais led to changes in congressional district maps across several Southern states, including Louisiana, Alabama, Tennessee and North Carolina.
The decision became part of the wider political debate surrounding representation and the Voting Rights Act. Changes to district boundaries affected the political landscape in several states, while voting rights remained an important issue in communities directly affected by redistricting.
In North Carolina, Republican mapmakers had pursued congressional boundaries intended to produce an 11-3 Republican advantage in the state’s delegation. However, Democrats were subsequently on track to hold an 11-3 majority, according to the NPR report.
The contrast between the intended political advantage and the reported outcome added another dimension to the election results. It also demonstrated that changes to district boundaries do not necessarily produce the political results expected by those drawing the maps.
The increased participation in majority-Black counties was particularly significant within this context. While the available figures do not establish that redistricting alone caused the turnout increase, they show that these communities played an important role in the broader electoral shift.
Georgia Moved Towards Democrats Across All 159 Counties
Georgia delivered one of the clearest examples of how the changing turnout patterns affected the Southern political landscape. All 159 counties in the state shifted towards Democrats compared with the 2024 presidential election, according to NPR’s analysis.
Democratic Sen. Jon Ossoff won his race by approximately 14 percentage points, flipping 12 counties along the way. His performance included suburban Fayette County, which had supported Trump by a significant margin during the previous presidential contest.
Ossoff received approximately 79,000 fewer votes than Harris had collected in Georgia in 2024. However, the overall number of ballots cast across the state was more than one million lower than during the presidential election.
That comparison helps explain how the Democratic candidate could improve his position despite receiving fewer votes than Harris. The decline in Democratic support was substantially smaller than the overall reduction in voter participation, while Republican candidates experienced a considerably larger drop.
Atlanta’s Suburbs Recorded Significant Republican Losses
The Atlanta metropolitan area provided another example of the changing voting patterns. Several counties surrounding the city recorded substantial declines in Republican votes compared with Trump’s 2024 total.
Fulton, Gwinnett, Cobb, DeKalb and Cherokee counties each lost between approximately 35,000 and 77,000 Republican votes. The declines were spread across communities with different political histories, showing that the change extended beyond a single county or local election.
Democratic candidates also experienced some losses in these areas, but their declines were considerably smaller. Gwinnett and Cherokee counties even recorded slight increases in Democratic votes compared with the previous presidential election.
The suburban results were particularly notable because they showed how Republican support weakened in areas that had contributed to Trump’s victory in Georgia. At the same time, Democrats managed to preserve more of their existing support across the metropolitan region.
Ossoff’s 14-point victory therefore reflected several overlapping developments. His campaign benefited from the smaller decline in Democratic participation, additional support in several counties and the substantial reduction in Republican votes across parts of the state.

South Carolina Produced A Significant Democratic Breakthrough
South Carolina was another state where the election results revealed substantial changes in local voting patterns. Democratic Senate nominee Annie Andrews secured a victory in a state where Republicans have traditionally maintained a strong position in statewide contests.
Some of the largest increases in Democratic votes came from Greenville, Spartanburg and Lexington counties. These areas recorded significant growth in the raw number of Democratic ballots compared with the 2024 presidential election.
Greenville County attracted particular attention because of its previous support for Trump. He carried the county by approximately 20 percentage points in 2024, but Andrews won it by around two points in the 2026 election.
That represented a substantial change in the county’s voting pattern within just two years. The result also showed that Democratic gains were reaching communities that had previously delivered comfortable Republican margins.
The figures from Greenville, Spartanburg and Lexington suggest that Democratic candidates benefited from stronger participation in several parts of the state. Their performance was not limited to a single population centre or an isolated group of traditionally Democratic voters.
The South Carolina result also contributed to the broader regional movement towards Democrats. Alongside victories in Mississippi and North Carolina, Andrews’s win demonstrated how changes in turnout could influence Senate races across states with different political histories.
North Carolina Exposed The Scale Of Republican Turnout Decline

North Carolina provided perhaps the strongest example of the difference between the two parties’ participation patterns. Former Democratic Gov. Roy Cooper won the state’s Senate race against Republican Michael Whatley by approximately 20 percentage points.
Whatley received around 1.25 million fewer votes than Trump had collected when he carried North Carolina in 2024. According to NPR’s analysis, that represented an approximately 43% decline in Republican support measured against the previous presidential vote.
The size of that reduction was particularly significant because North Carolina had been a closely watched state during recent presidential elections. The 2026 Senate result showed how dramatically the electorate’s composition could change between two election cycles.
Republican losses were particularly pronounced in the state’s largest population centres. Wake County, home to Raleigh, recorded approximately 100,000 fewer Republican votes than in 2024, while Mecklenburg County, which includes Charlotte, experienced a decline of around 90,000.
Across North Carolina, Republican candidates received only about two-thirds of the votes Trump had secured in the state during the previous presidential election. No other state in the six-state analysis showed a more striking Republican decline.
Roy Cooper Benefited From A Different Electorate
Cooper’s victory demonstrated how a Senate candidate could benefit when the opposing party experienced a substantial reduction in participation. His 20-point margin came alongside a sharp decline in Republican votes across the state, creating a much different electoral environment from the one Trump faced in 2024.
The comparison between Cooper and Whatley’s vote totals is particularly revealing. Whatley received approximately 1.25 million fewer votes than Trump, while Democratic candidates across the six Southern states generally experienced smaller declines from their previous presidential totals.
The available figures do not establish that every former Republican voter stayed home or changed political allegiance. However, they clearly show that Republican candidates received considerably fewer votes than Trump had collected in the same states.
That distinction matters when examining the election because turnout and party preference are two different measurements. A decline in Republican votes can reflect lower participation, changes in candidate support or a combination of both factors.
North Carolina’s results were therefore part of a much wider regional pattern. The Republican decline occurred alongside stronger Democratic participation in several communities, helping Cooper secure a substantial victory.
Republican Vote Totals Fell Across The Southern States
North Carolina’s experience was not an isolated case. NPR’s analysis found that no county or parish across the six Southern states came close to matching Trump’s 2024 vote total.
The smallest Republican decline occurred in Greene County, Georgia. Even there, Republican candidates retained only approximately 83% of Trump’s previous raw vote total, making it the only one of the 518 counties examined where Republicans received more than 80% of his 2024 votes.
The figures suggest that Republican participation declined across a wide range of communities, including areas where the party had previously performed strongly. The reduction was particularly noticeable in metropolitan areas and suburban counties where Democratic candidates also recorded comparatively smaller losses.
Atlanta’s surrounding communities experienced some of the largest declines outside North Carolina. Several counties recorded tens of thousands fewer Republican votes, while Democratic candidates managed to maintain more of their previous support.
The pattern was especially pronounced in Fulton, Gwinnett, Cobb, DeKalb and Cherokee counties. Their Republican vote losses ranged from approximately 35,000 to 77,000, according to the analysis.
Meanwhile, Democratic candidates recorded slight increases in Gwinnett and Cherokee counties. Those gains added to the difference between the parties and helped explain the wider movement towards Democrats across Georgia.

The Main Numbers Behind The Regional Shift
Several figures from the NPR analysis help illustrate the scale of the changes recorded across the six states. Together, they show how participation patterns differed between Democratic and Republican voting communities during the 2026 midterms.
- 19% turnout decline: Counties carried by Harris in 2024 experienced an average turnout reduction of approximately 19%.
- 26% turnout decline: Counties carried by Trump recorded a larger average reduction of approximately 26%.
- 85% participation: Majority-Black counties recorded approximately 85% turnout, compared with 76% in majority-white, non-Hispanic counties.
- 170 counties: Democratic Senate nominees received more raw votes than Harris had collected in 2024 across 170 counties.
- 1.25 million fewer votes: Michael Whatley received approximately 1.25 million fewer votes than Trump had secured in North Carolina.
- 22-point regional swing: The six Southern states recorded an average 22-percentage-point shift towards Democrats, compared with approximately 14.5 points nationally.
These figures demonstrate that the regional shift involved several overlapping patterns rather than one isolated development. Democratic candidates retained more voters in many communities, majority-Black counties recorded higher participation and Republican candidates experienced significant reductions in their vote totals.
The 2026 Results Put Southern Politics In Focus Ahead Of 2028
The Democratic gains across the South have created a different political landscape heading towards the next presidential election. Victories in North Carolina, South Carolina and Mississippi, combined with Ossoff’s performance in Georgia, demonstrated how much the region’s electoral balance could change between presidential and midterm contests.
The results also give both parties specific voting patterns to examine. Democrats will be looking at the communities where participation increased and where their candidates managed to attract more votes than Harris received in 2024.
Republicans, meanwhile, will have to assess why their candidates received substantially fewer votes than Trump in numerous counties. The losses in North Carolina and the Atlanta metropolitan area provide particularly significant examples of the decline recorded across the region.
However, the midterm results do not guarantee that the same patterns will continue in 2028. Presidential elections generally attract a different electorate, and the candidates, campaign issues and political circumstances will also be different.
The Southern results nevertheless provide a detailed picture of what happened in 2026. The difference between a 19% turnout decline in Harris-won counties and a 26% decline in Trump-won counties helps explain why Democrats gained ground across several states.
For Republicans, the immediate challenge is understanding where their voters disappeared between the two elections. For Democrats, the task is maintaining the participation levels that helped change the results across the South.